The Creator's Blueprint: Using Social Media Analytics to Find Your Next Viral Idea
Creating content that truly resonates with your audience goes beyond just posting regularly. It requires understanding what works and why. Social media analytics equips creators with the insights to craft engaging, informative, and inspiring content. By analysing your data, you can spot trends, uncover audience preferences, and predict which posts have the potential to go viral. According to recent studies, 80% of businesses report increased engagement after integrating analytics into their social media planning.
In this comprehensive blueprint, we will simplify the essential metrics, teach you how to reverse-engineer success from your past content, and show you how to use data to stop guessing and start creating your next high-performing, viral idea.
Decoding Social Media Analytics: What You're Really Measuring
Social media analytics is the process of translating raw audience behavior (likes, clicks, views) into actionable intelligence that drives your business objectives. It is the language your audience uses to tell you what they want.
The Three Pillars of Performance:
To understand your content's impact, you must track these core metrics:
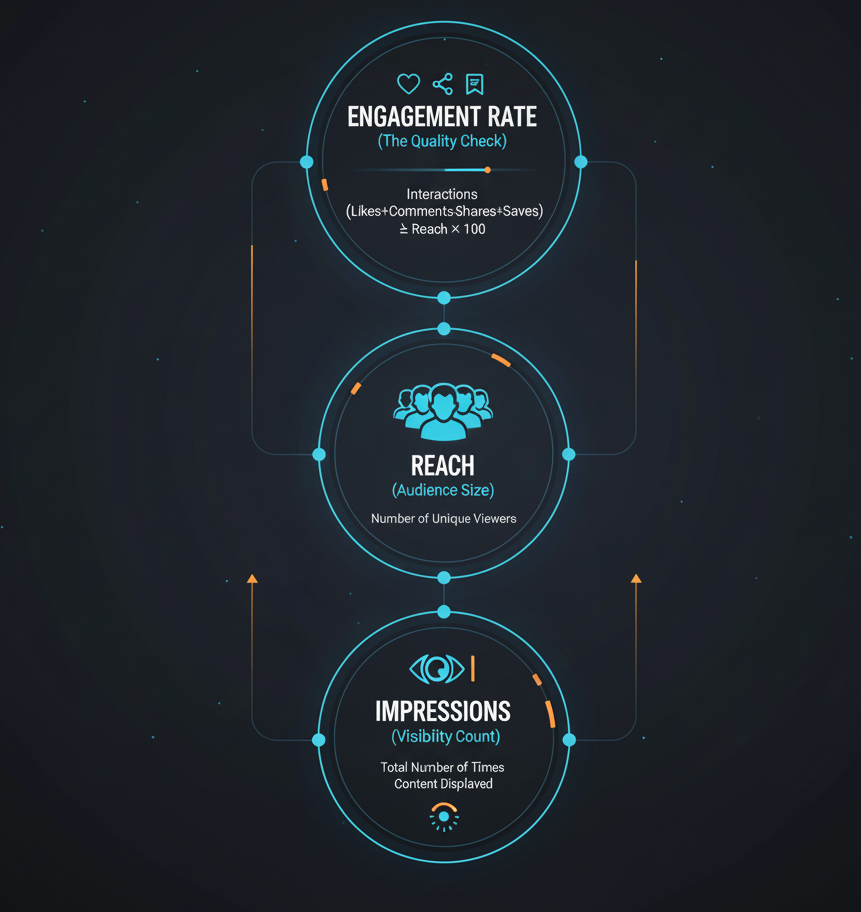
- Engagement Rate (The Quality Check): This is the most crucial metric for creators. It measures the quality of interaction relative to the visibility of your post. It tells you if your content is good.
- Calculation: Total Interactions (Likes + Comments + Shares + Saves) ÷ Reach (or Followers) × 100.
- Why it Matters: A high engagement rate signals to the platform's algorithm that your content is valuable, boosting its priority in feeds.
- Reach (The Audience Size): This is the number of unique accounts that saw your content. It tells you how many people you are connected with.
- Why it Matters: Reach is the most direct measure of your content's organic distribution power.
- Impressions (The Visibility Count): This is the total number of times your content was displayed. It tells you how often your content was seen.
- Key Distinction: One user can generate multiple Impressions, but only one unit of Reach. Comparing high Impressions with low Reach can indicate you're showing content repeatedly to the same small group.
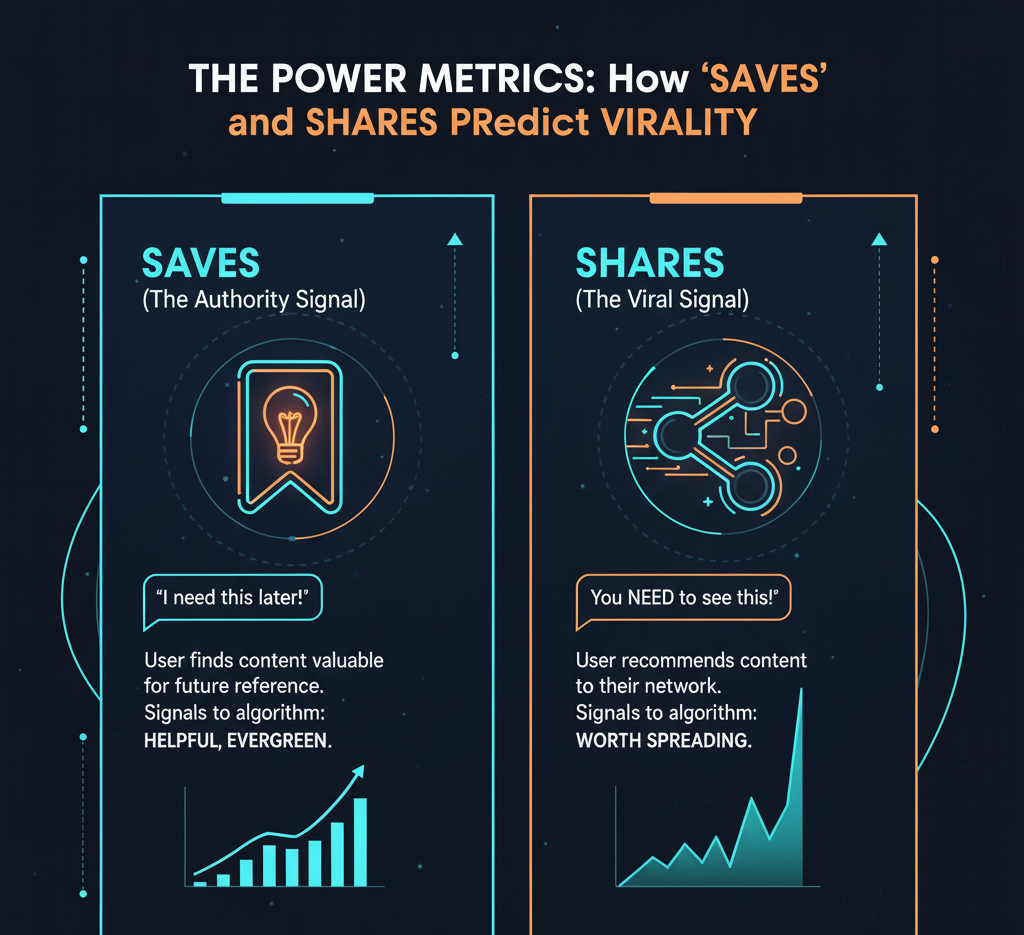
The Power Metrics: How 'Saves' and 'Shares' Predict Virality
While ‘likes’ are good to have , 'saves' and 'shares' are the strongest indicators of content authority and virality. They tell the algorithm that your content is worth long-term distribution.
- Saves (The Authority Signal):
- What it Means: The user found your content so helpful or valuable that they stored it to reference later. This is the internet equivalent of bookmarking a study guide.
- The Content Focus: Content that generates high saves is typically tutorial-based, educational, step-by-step guides, or highly valuable checklists.
- Shares (The Viral Signal):
- What it Means: The user is vouching for your content's relevance by passing it along to their personal network. This is the platform's highest form of social proof.
- The Content Focus: Content that generates high shares is often highly relatable, deeply polarising (in a constructive way), or contains a powerful, shareable idea.
Reverse-Engineering Success: Deconstructing High-Performing Posts
Your past successes hold the blueprint for your future virality. The process of analysing high-performing posts allows you to move from guessing to making a data-informed, strategic bet on your next piece of content.
The Analysis Workflow:
- Identify the Winners: Pull the data on your top 10 posts from the last 90 days, prioritising those with the highest Saves-to-Reach ratio.
- Define the Winning Elements: Break down the posts into component parts:
- Topic: Was it a specific niche, a broad topic, or a trending event?
- Format: Was it a carousel, a 30-second Reel, a graphic quote, or a long caption?
- Hook: What was the first 3-5 seconds of the video or the first sentence of the caption?
- Call-to-Action (CTA): Did a specific CTA drive more comments or shares?
- Create a Formula: Once you find a pattern (e.g., "30-second videos of 'how-to' tips, using a question as the hook"), you have found your content formula. Replicate and build upon this formula.
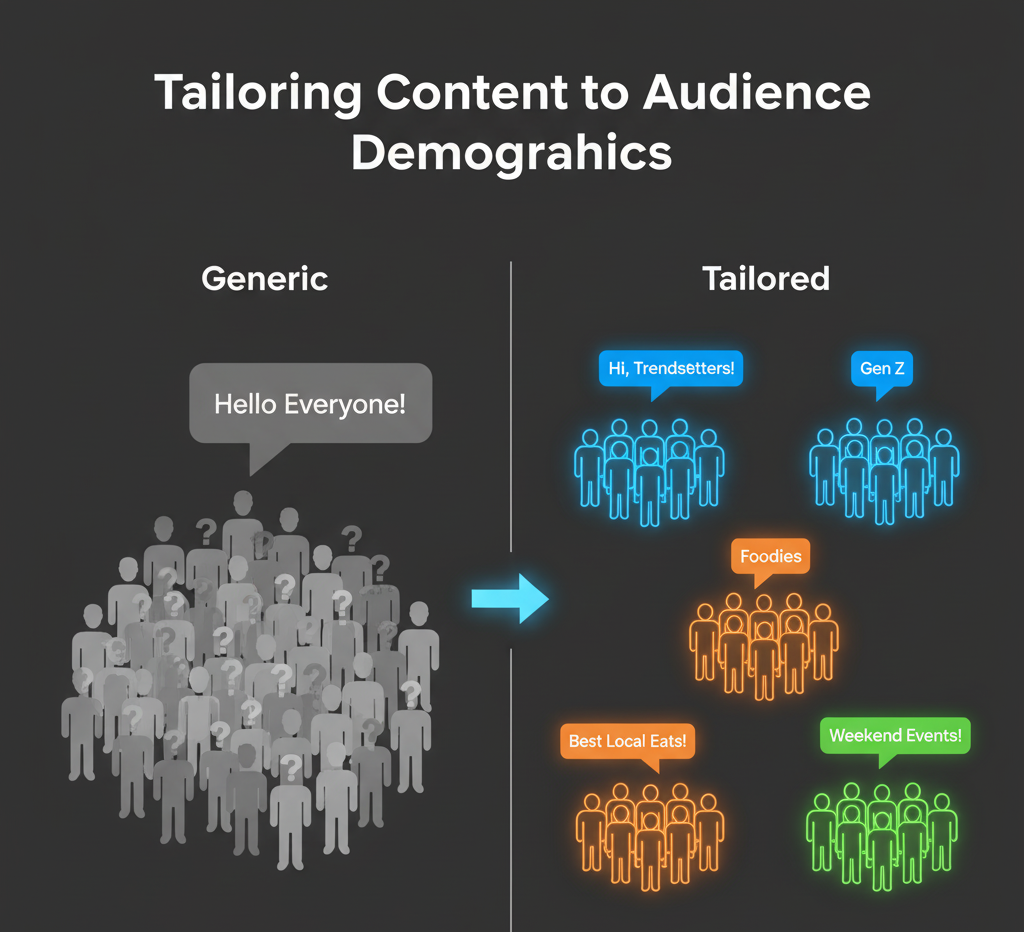
Tailoring Content to Audience Demographics
A generic message connects with no one. To create content that clicks, you need to understand who your audience is and what they want. Data on audience demographics, such as age, location, and gender, can inform your content strategy significantly. This information allows you to craft messages that cater to the specific preferences of your audience
- Tone and Format: If you have a younger audience, you may need a more fast-paced editing style and a direct, conversational tone. If they are older, longer, more informative captions or detailed guides may perform better.
- Localisation: Geographical data can inform your examples, holidays, or specific references, making the content feel local and personal.
- Platform Alignment: Knowing where your audience spends their time (e.g., Instagram vs. LinkedIn) should dictate your format.
Utilising Analytics as a Data Feedback Loop
The most sophisticated creators treat analytics as a continuous, scheduled feedback loop. This is not a quarterly review; it is a weekly discipline.
- The Iteration Cycle: Review the data → Identify one winning pattern → Test a new version of that pattern → Review the results → Repeat.
- Why Consistency Matters: Regular, consistent posting provides the necessary volume of data points to ensure your analysis is statistically sound and not based on a single, lucky post.
Tools for Social Media Analytics
You don't need to manually calculate everything. Leverage these tools to gather data and make informed decisions:
- Native Platform Insights: The analytics built into Instagram, TikTok, Facebook, etc., are the most accurate source for true Engagement, Reach, and Impression data.
- Google Analytics: Essential for understanding the quality of traffic driven from social media to your website (e.g., did they convert or just bounce?).
- Third-Party Suites (e.g., CXG Sprout Social, Hootsuite): Useful for multi-platform reporting and comparing performance across channels in a single dashboard.
Leverage these tools to gather data and make informed decisions about your content strategy.
Conclusion: Transform Data Into Action
You now have the creator's blueprint. Understanding social media analytics is crucial for creating an impactful content strategy that resonates with your audience. By measuring engagement rates, reach, and impressions, and focusing on valuable metrics like saves and shares, you can refine your approach to content creation. Analysing past successes will help you uncover patterns and themes, allowing you to deliver relevant messages tailored to your audience's preferences. Use your analytics as a feedback loop, remain consistent in your posting, and utilise available tools to elevate your social media efforts. Explore how you can elevate your content strategy today with CXG
Remember, the key to effective social media engagement is not just what you post but understanding how your audience interacts with that content and what they value most.
Sources